How to measure impulse responses with the Sine Sweep, guide for correct I.R. measurements

« Older   Newer »
  Share  
view post Posted on 21/1/2011, 00:20
Avatar

http://www.angelofarina.it

Group:
Administrator
Posts:
365
Location:
Parma, Italy

Status:


First of all, it is assumed that the user already knows what is a room impulse response, and how to measure it employing an impulsive source (pistol, firecracker, balloon, etc.).
The Exponential Sine Sweep method employs a loudspeaker playing a continuous sinusoidal sound instead of an impulsive source.
The sound is simultaneously played and recorded. Afterwards, the recording is processed, with a mathematical procedure called "deconvolution", which reconstructs the impulse response from the not-impulsive recorded signal.
In the past this method was employed with other types of test signals, namely MLS (Maximum Length Sequence) and TDS (Time Delay Spectrometry), also called TSP (Time Stretched Pulse), which indeed is simply a Linear Sine Sweep.

The modern Exponential Sine Sweep presents several advantages over all the previously known methods, as widely discussed in at least a dozen of scientific papers, the first was the famous AES pre-print presented by A.Farina at the 108th AES Conventon, Paris, 2000:
www.angelofarina.it/Public/Papers/134-AES00.PDF

And here for a further article describing improvements:
www.angelofarina.it/Public/Papers/226-AES122.pdf

Here we are not discussing these advantages, nor the mathematical theory which makes them possible. Here we give simply a quick guide on how to use some of the Aurora plugins for performing a correct Impulse Response measurement.

The first thing to do is to setup your audio equipment. you need to have a PC, possibly portable, a good quality external sound card (internal sound cards are too noisy for good measurements), connected with the PC through a digital connection, such as Firewire or USB.
You can either select a sound card already equipped with good-quality microphone preamplifiers, with digital stepped gain control such as some RME, Roland or MOTU models, or employ the fixed-gain line inputs of the sound card, employing an extrenal professional preamplifier, or the AC output of a sound level meter. In any case, you must be able to keep a controlled input and output gain, so that your measurement system can be calibrated.
Low-end sound cards are instead equipped with analog knobs, they cannot be calibrated, and they are strongly deprecated for professional usage together with Aurora plugins.
We recommend to perform impulse response measurements employing a sampling rate of 48 kHz minimum, and a resolution of at least 24 bits (32 bit float recommended).
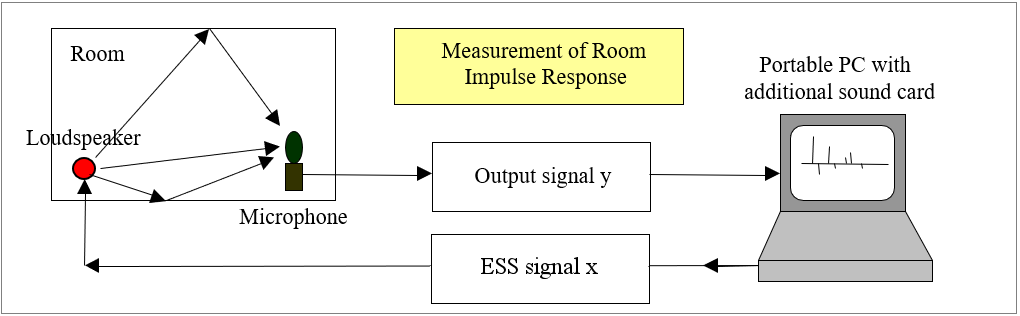
In the basic arrangement, the measurement is performed synchronously, so the same PC will play the test sound and simultaneously record the signal coming from the microphone(s). This means that the system must be completely wired, with a cable connecting the output of the sound card to the loudspeaker (employing an external amplifier, if your loudspeaker is not self-powered; however, the usage of self powered loudspeakers is recommended).
Another cable will connect the microphone with the input of the sound card.
In practice, the completely wired system will be as follows:
Image1

It's time now to generate our test signal, the Sine Sweep.
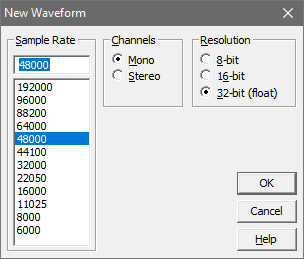
We first create a new, empty file in Adobe Audition, with the command "File - New". We are asked to choose the sampling rate (48 kHz), the number of channels (mono, as we have just one loudspeaker) and the resolution (ALWAYS 32 bits - float, for better results, despite the effective resolution of our sound card).
Image2

We can now invoke the Aurora "Generate Sweep" plugin:
Image4

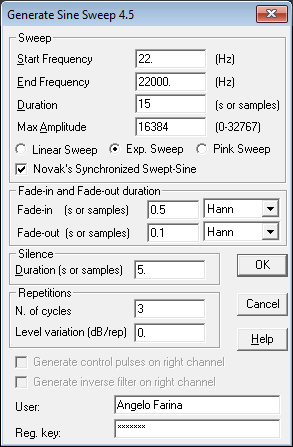
We leave all the parameters at their default values: the start/stop frequencies are 22 Hz and 22 kHz respectively, the sweep is long 15s, followed by a silence of 5s, and the whole sequence is repeated 3 times.
Of course, if your loudspeaker cannot manage very low frequencies, it could be advisable to start from 40 or even 80 Hz, loosing information at the first one or two octave bands (31.5 and 63 Hz).
When "OK" is pressed, a warning appears on the screen:
Image5

This warning gives you information about the fact that not only the sweep signal has been generated, but also its inverse sweep has been generated too, and the inverse sweep is saved in the Windows clipboard.

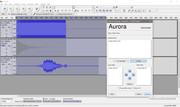
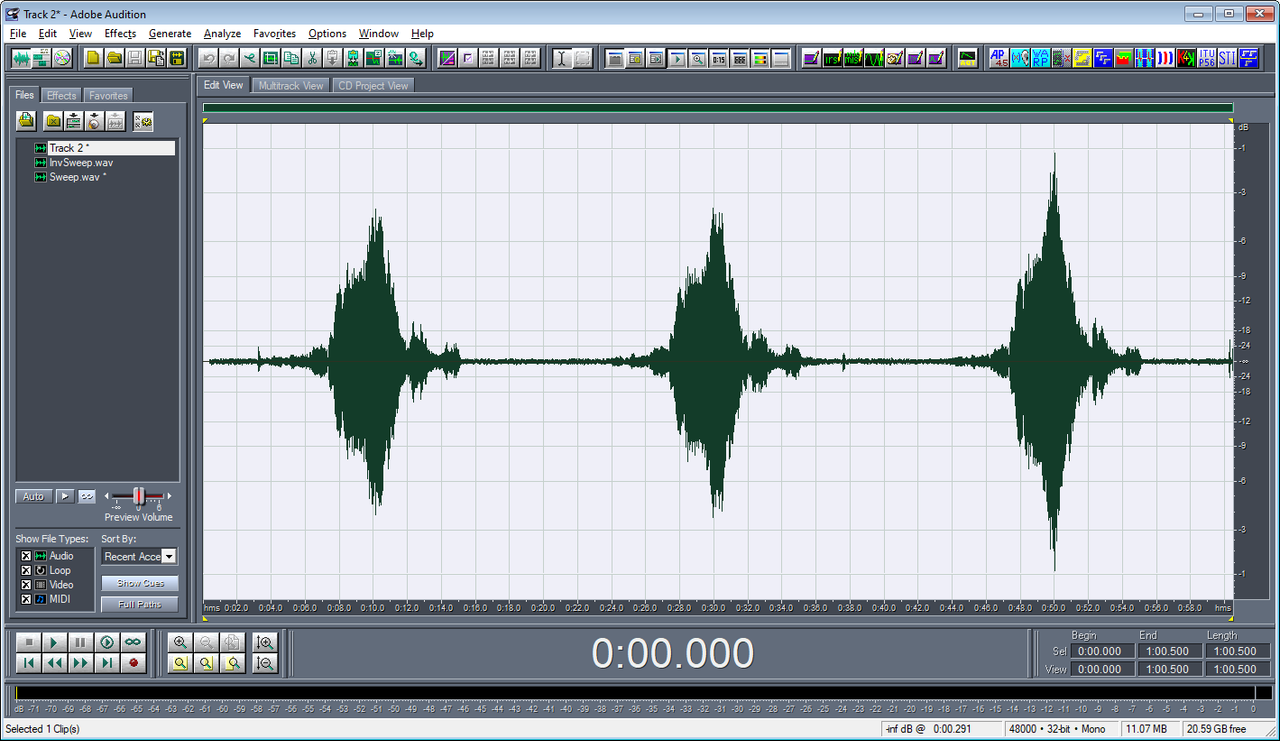
Pressing OK, your sequence of 3 sweeps appears:
Image7

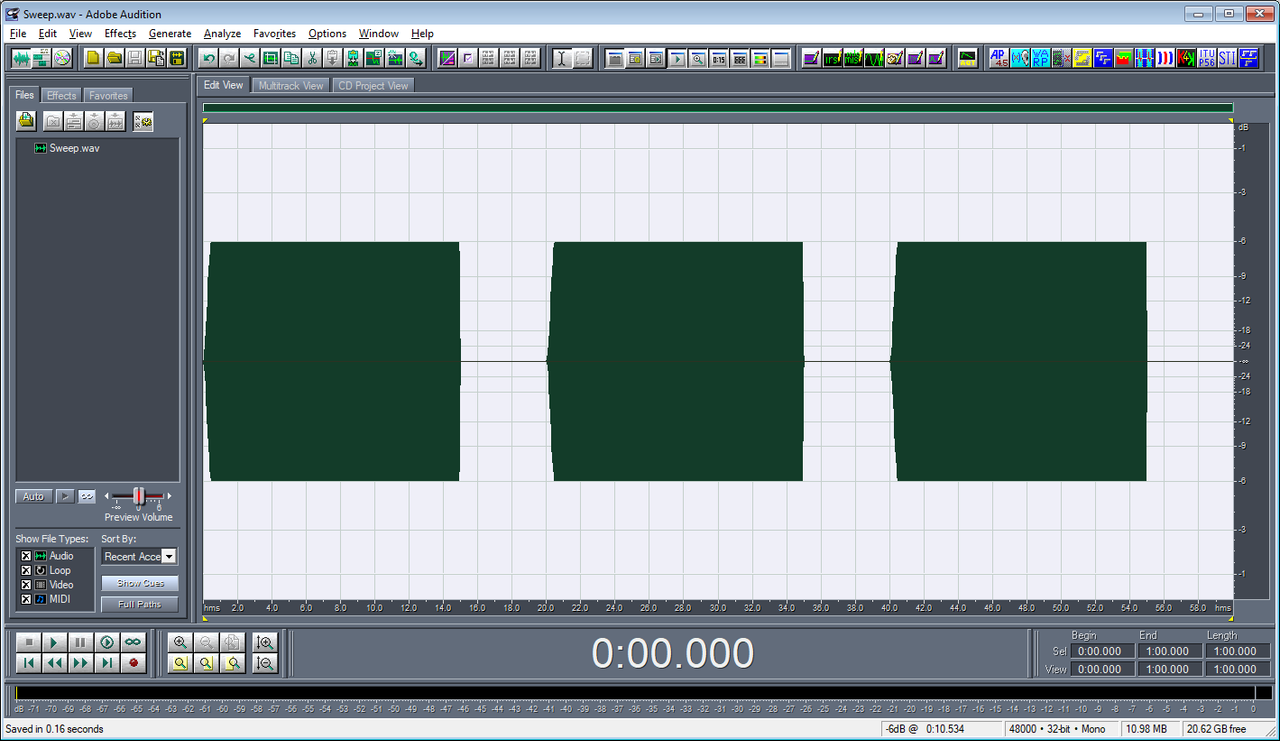
It is advisable to immediately save this newly generated waveform, as SWEEP.WAV.

At this point it is also advisable to explain that Audition has several clipboards: 5 "internal" clipboards, numbered #1 to #5, and then the standard Windows Clipboard. It is the latter the one employed by Aurora plugins.
So, if we want to retrieve the Inverse Sweep laying inside the Windows Clipboard, we must first instruct Adobe Audition to employ that clipboard, instead of its internal one, which was the default. For this, we employ the command "Edit - Select Curent Clipboard", and we choose the last one, named "Windows Clipboard".
We can now retrieve the Inverse Sweep signal, employing the command Edit - Paste to New. The following signal appears on the screen:
Image8

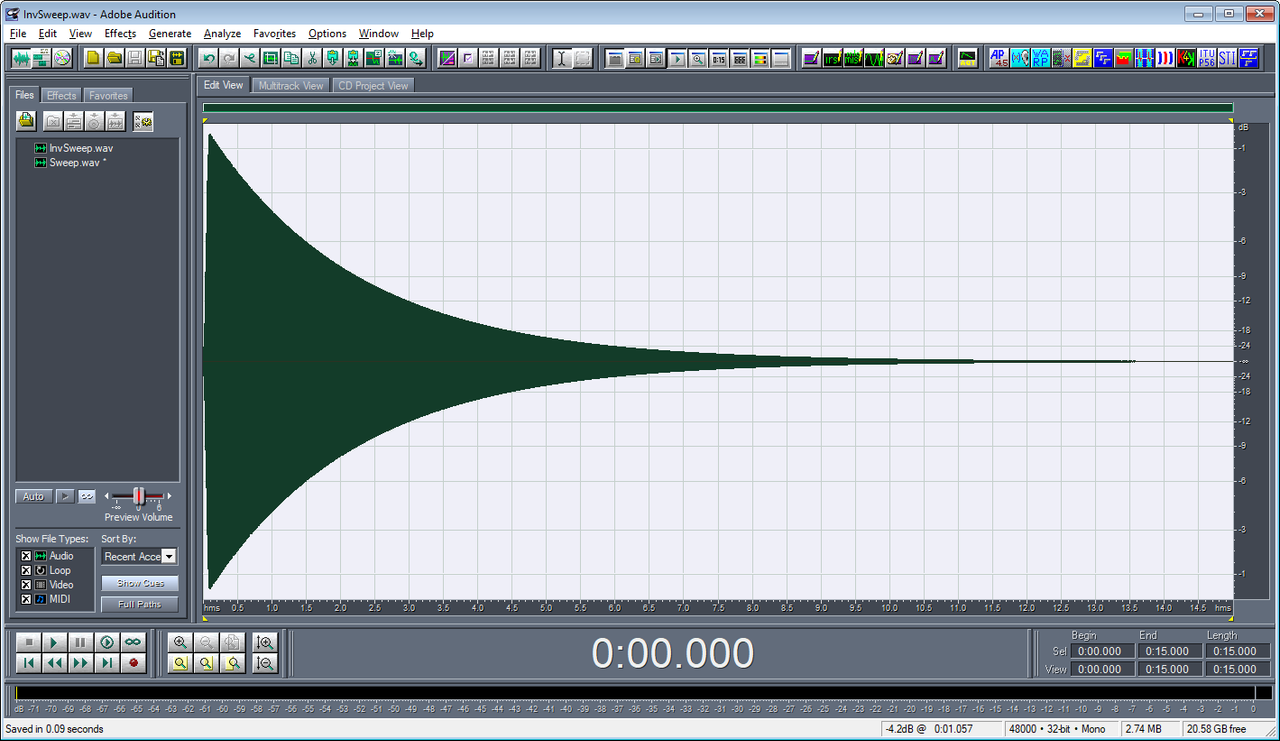
We notice that, whilst the Sweep signal has constant amplitude, the InvSweep has decreasing amplituide. This compensates for the fact that the spectrum of the exponential sine sweep signal is not flat (white), but instead is falling by 3 dB/octave (pink). So the spectrum of the inverse sweep must be adjusted, to be increasing by 3 dB/octave, so that, when we will employ the inverse sweep as a deconvolution filter, it will restore perfect flatness of the measured impulse response.
After having saved to disk also INVSWEEP.WAV, we are ready to perform the measurement.
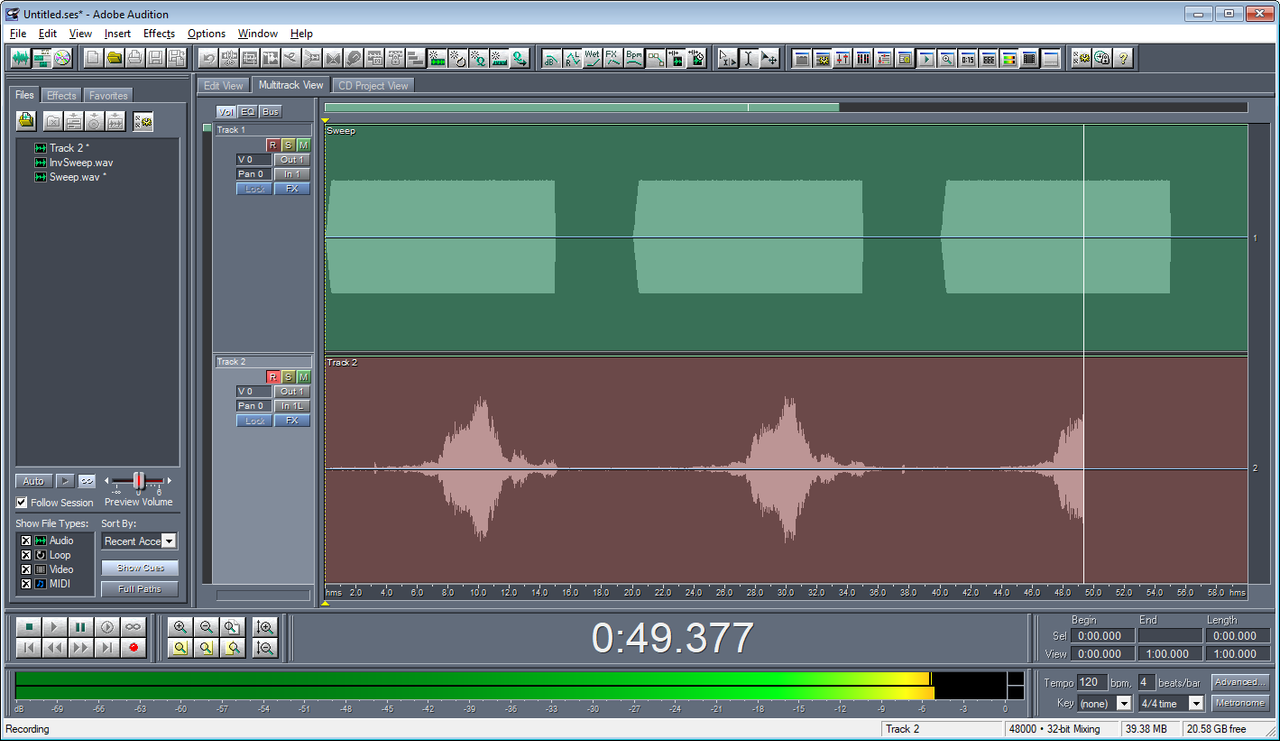
We switch Audition to Multitrack mode, and insert the Sweep.wav signal in track 1. This track will be used for playback.
We now press the red button marked "R" of track 2, as this will be the track being recorded, it is where the signal coming from the microphone will be captured. If the microphone is mono, we specify that this is a Mono track. If instead we are employing a stereo microphone, for example a binaural microphone, or a pressure-velocity probe, then we will specify that track 2 is armed for stereo recording.
In this example we record a stereo signal employing a pair of small microphones inserted in the ear channels.
After setting up track 1 for playback and track 2 for recording, we press the round red button which starts the recording (track 1 is automatically played, synchronously with the recording); this is what appears during the recording:
Image10

After the recording is finished, we double click on the recorded Track 2, so that we come back to Edit Mode:
Image11

It can be interesting now to observe the recorded signal in Spectral View (View - Spectral View):
Image12

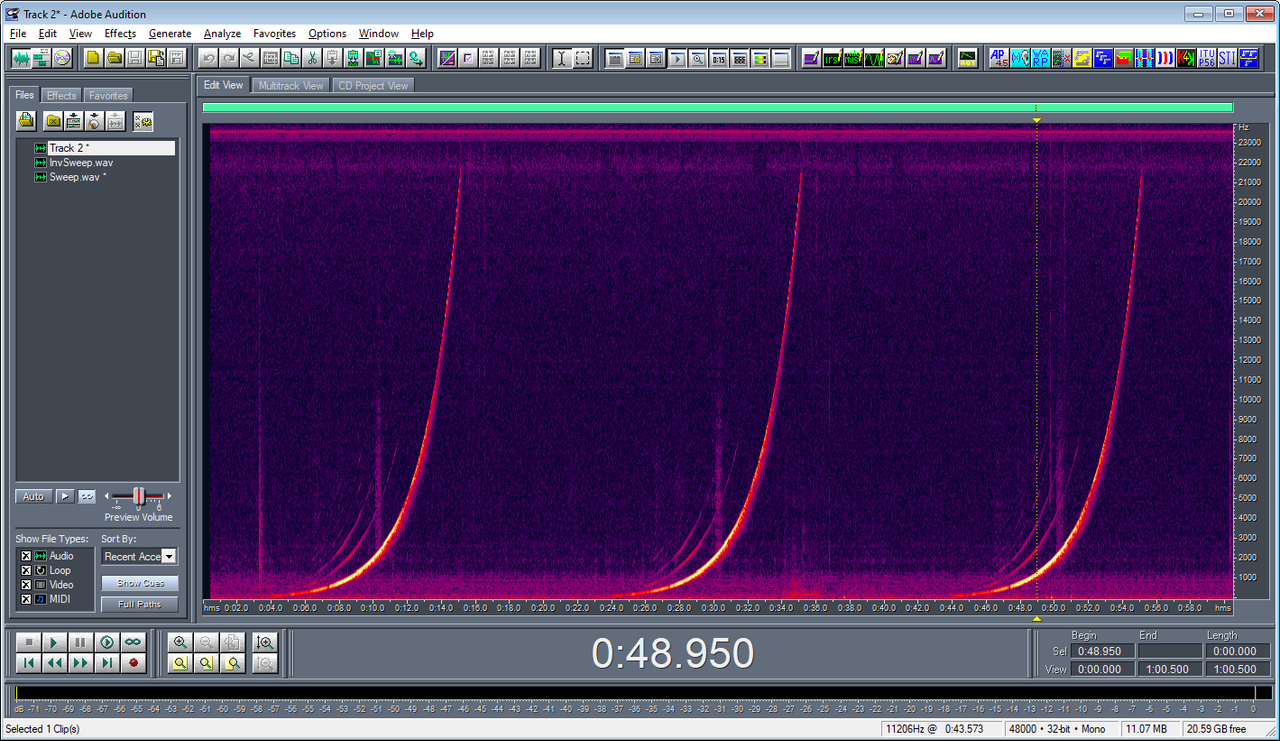
We can see that there is not just ONE sweep, there are several ones, superposed. Taking an instantaneous spectrum where the cursor is placed (Window - Frequency Analysis) , we see this FFT spectrum:
Image13

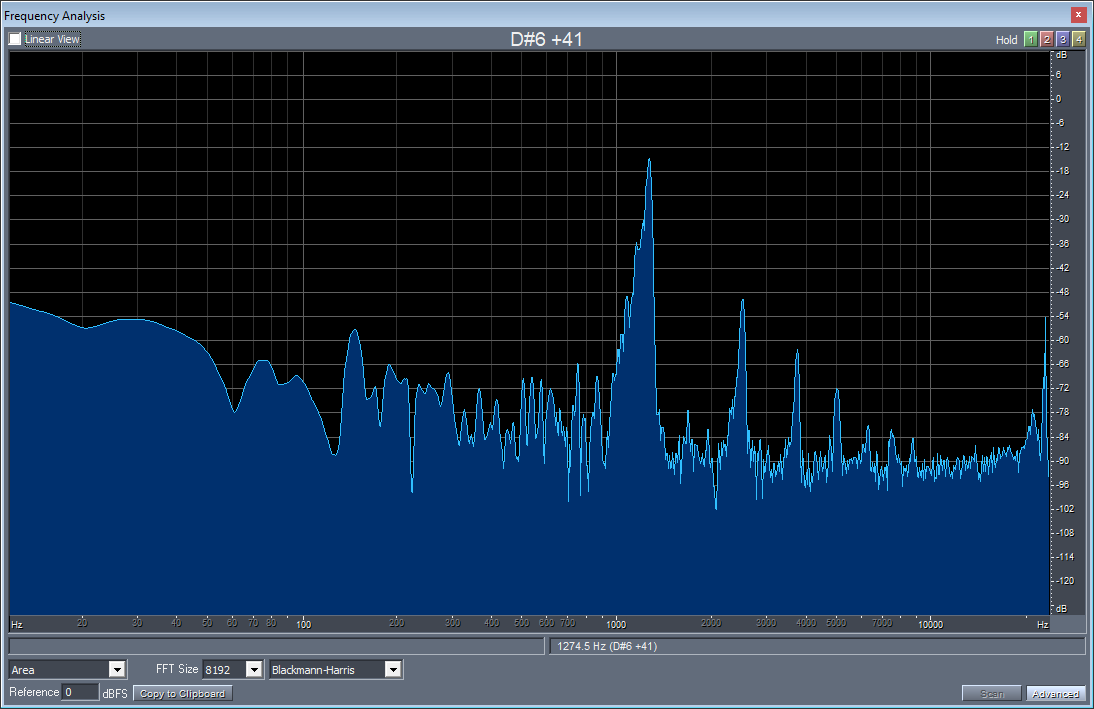
We see that there is a "fundamental" frequency, corresponding to the one generated by the original Sweep signal, but there are also peaks at frequencies double, triple, quadruple, etc... These are the harmonic distortion products, caused by nonlinearities in the loudspeaker. These distortion products could affect significantly the results, and the capability of completely removing them is one of the big advantages of the Exponential Sine Sweep method.
We come back to standard Waveform View, and we can now perform convolution of the recorded signal with the Inverse Sweep, which should be in the Windows clipboard yet (if it is gone, we can easily re-copy it to the clipboard, as we did save it).
For doing that, we invoke the Aurora "Convolve with Clipboard" plugin:
Image14

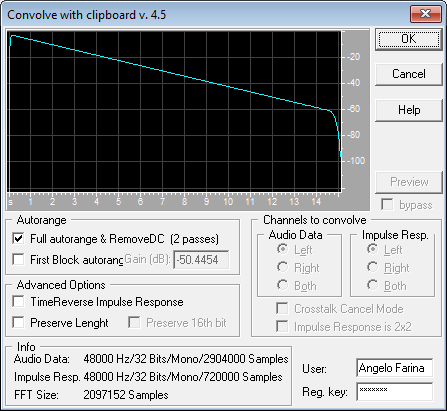
We maintain the standard settings, in particular the "Full Autorange" feature enabled. We press OK, and after a couple of seconds we see the final warning window:
Image15

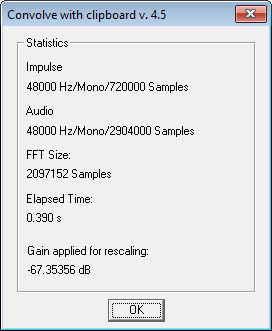
It is interesting to observe the value of gain applied during the autorange process: -67.35 dB. This is the reduction of background noise achieved thanks to the sine sweep method. If a good loudspeaker is employed, this value can be close to 80 dB....
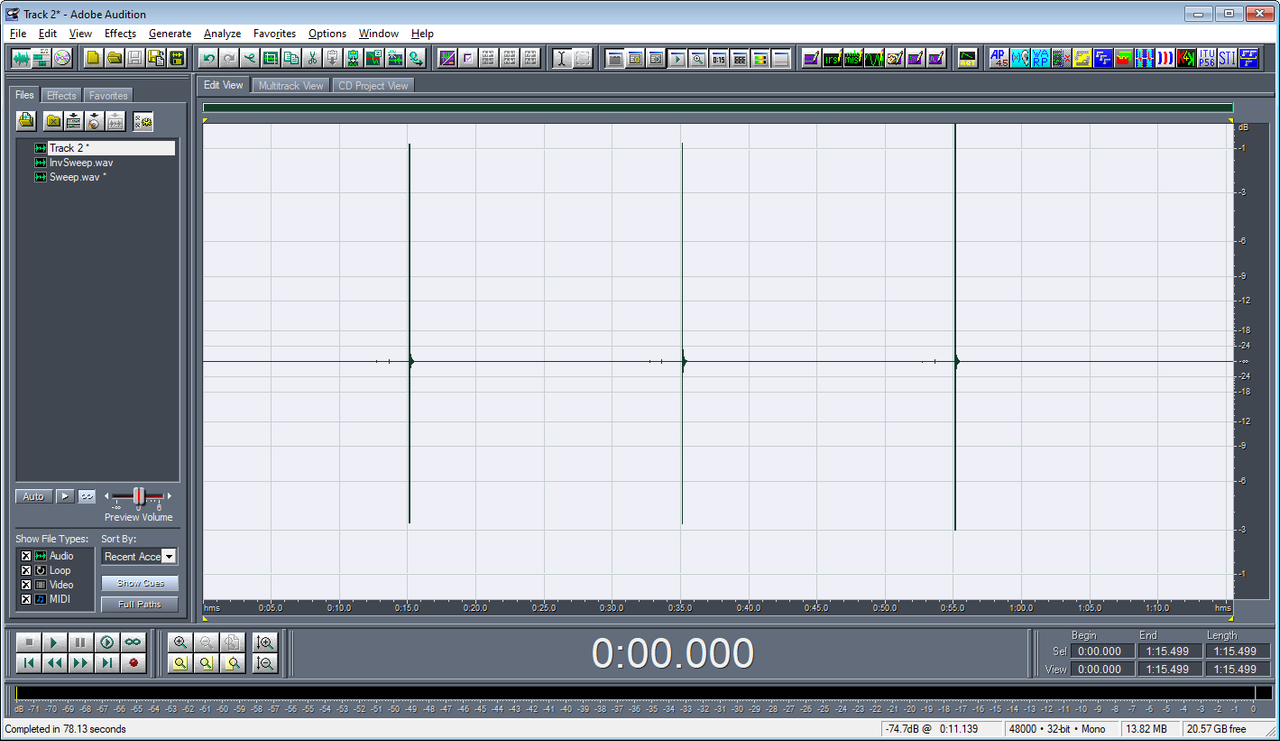
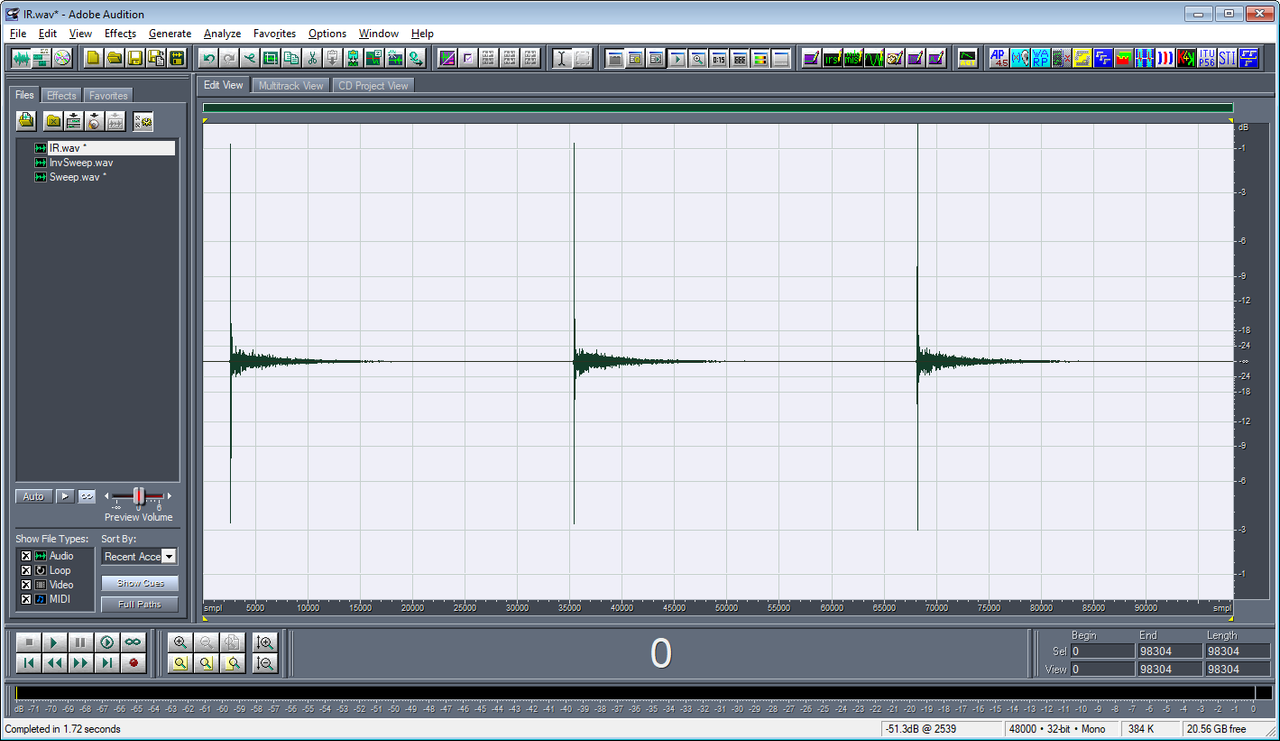
When we press OK, instead of the recorded sweeps, we see a sequence of impulse responses:
Image16

We now zoom at the first group of pulses, the ones resulting form the deconvolution of the first sweep:
Image17

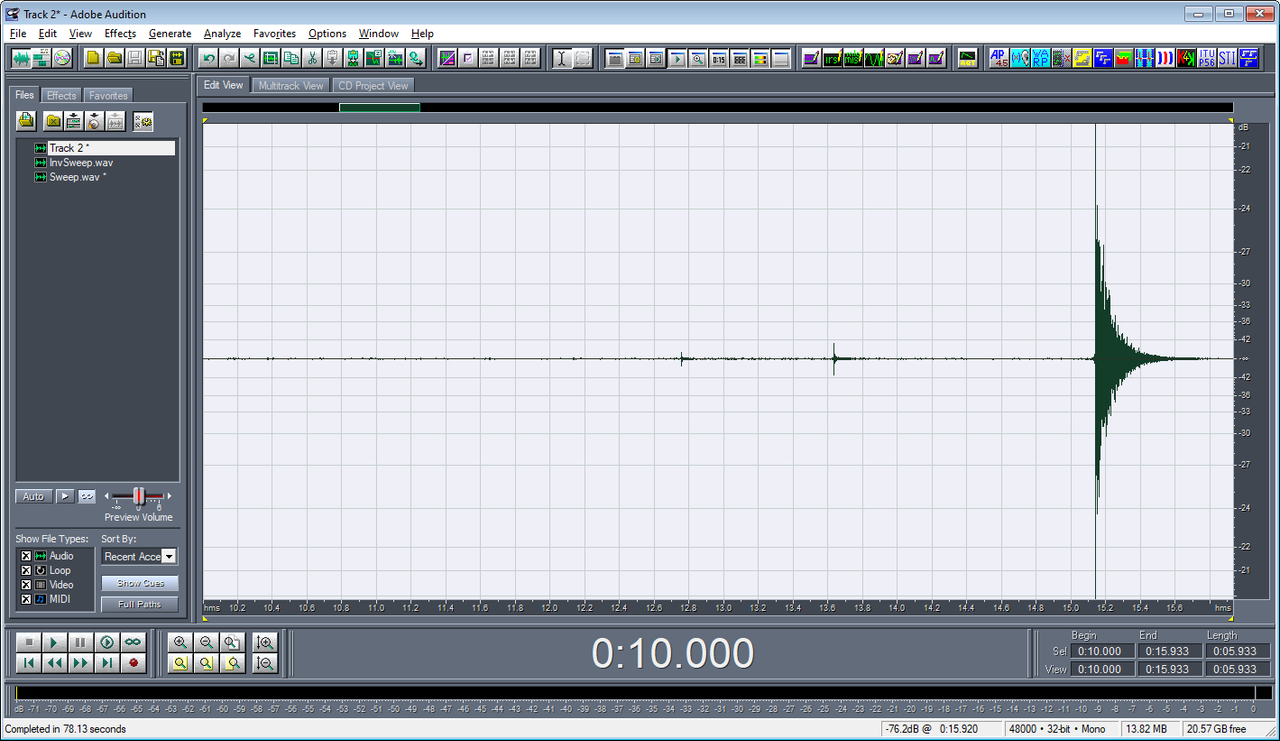
The rightmost impulse response is the linear one, the one which we are interested into. The preceding ones, of smaller amplitude, are the distortion products, and we want to discard them, by applying proper windowing in time domain.
This windowing can be done by hand (Audition is very good at cut-and-paste operations), but we also have a specific Aurora plugins which takes care of "slicing" the measured multiple impulse response, leaving only the portion we are interested into.
So we invoke the Aurora plugin called Impulse Response Select:
1rsw3n

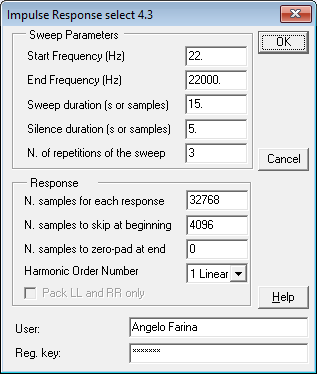
It can be seen that we are specifying exactly the same parameters employed for the generation of the sine sweep. We are also specifying to cut just 32768 samples of each linear IR, as this measurement was performed inside a small room, with short reverberation time. And we are stripping away the first 4096 samples, as the measurement was done employing a sound card which was employing I/O buffers of 2048 samples, hence a latency of 4096 samples is added to the "time of flight" and must be removed, if we want that the measured IR begins at true "zero time".
Of course, in a large room you must keep a much longer IR, 100.000 samples or more...
Pressing OK we see the sequence of our 3 "cut" linear impulse responses, one for each sweep emitted:
33otiqc

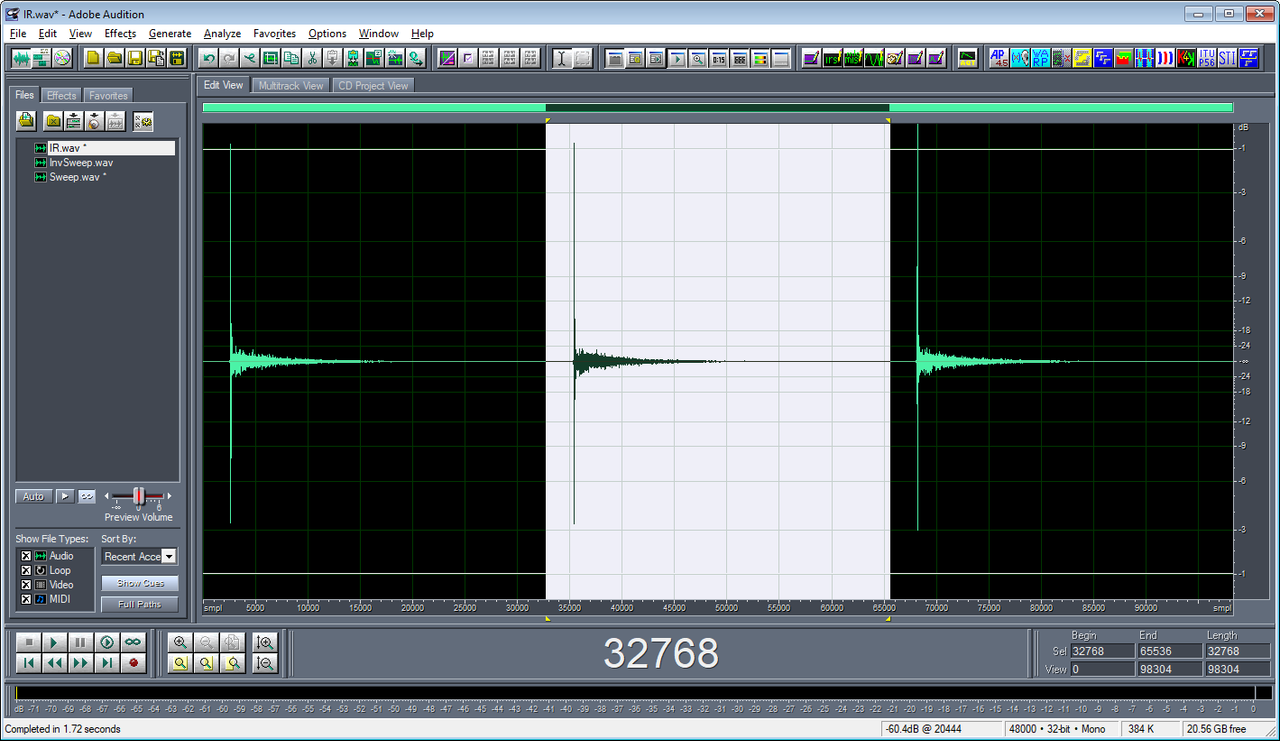
What to do with a sequence of 3 IRs? Simple... Let's just select the "best" one... For selecting, it is advisable simply to play the sound, and listen to what of the 3 is more clean... We decide that the second one is the most clean. So we now manually select it with sample accuracy, by keying-in the values of the samples at which the selection must start and its length (in the right-bottom corner of the Audition screen): 32768 as the begin sample and again 32768 as the selection length:
scz58j

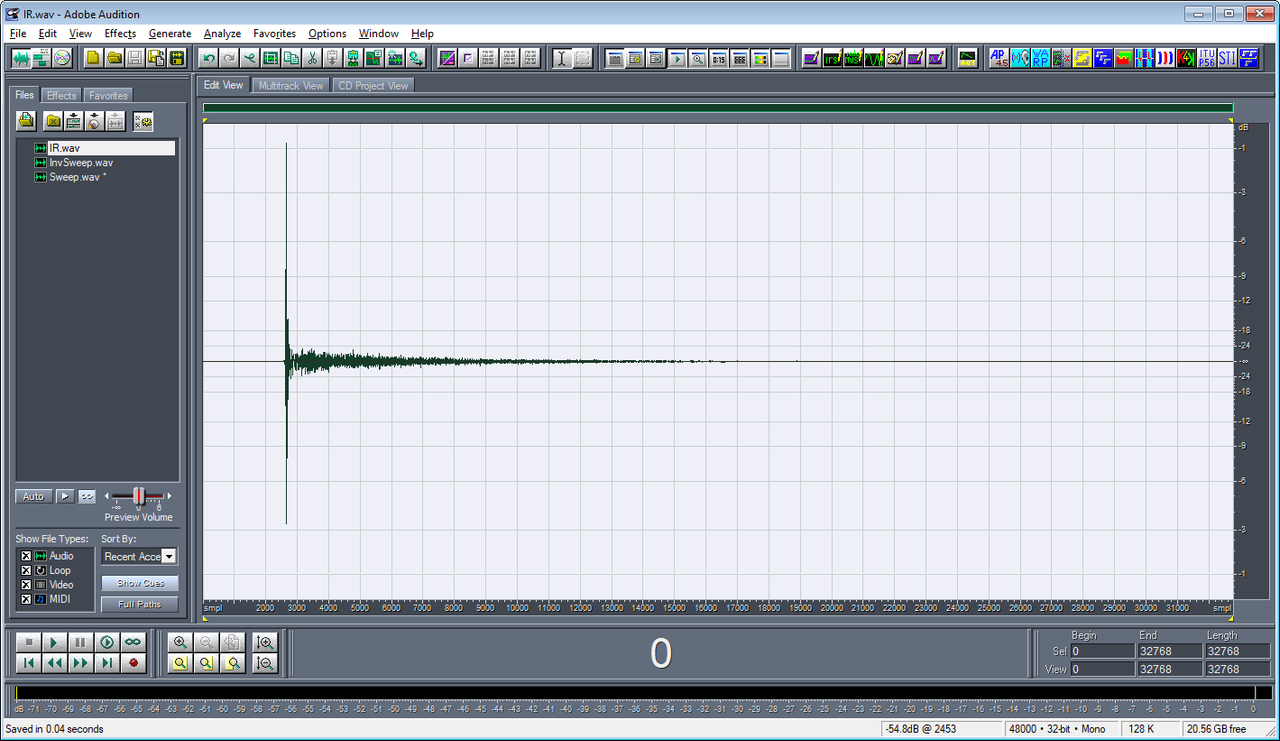
We are almost done. We now trim the selected waveform (Edit - Trim or simply CTRL-T), discarding the other two IRs, and we save the result, which is our measured IR:
5vbrph

We can now employ our measured IR, for example, for computing the room acoustical parameters following the ISO 3382 standard, by invoking the Aurora "Acoustical Parameters" plugin:
2crq1rt

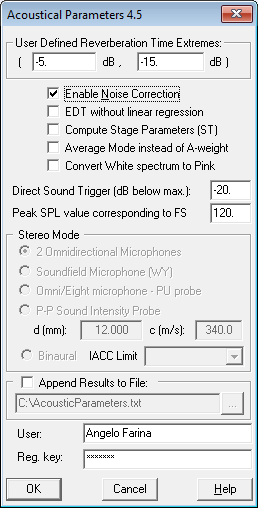
Please note that the "Stereo Mode" part is greyed out, as this recording was mono. If instead we had employed a pair of microphones, for example a dummy head, then we had selected "Binaural microphone".
The results of "spatial parameters" is accurate only if we select the correct type of stereo microphone employed.
Pressing OK, we see the results:
15ob79j

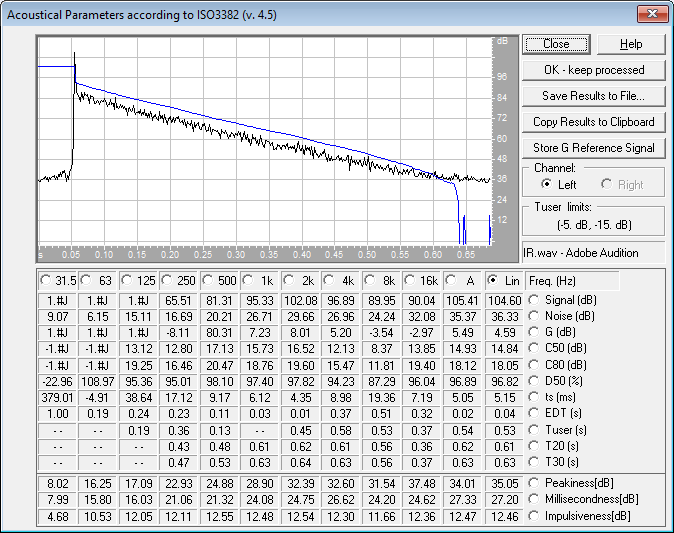
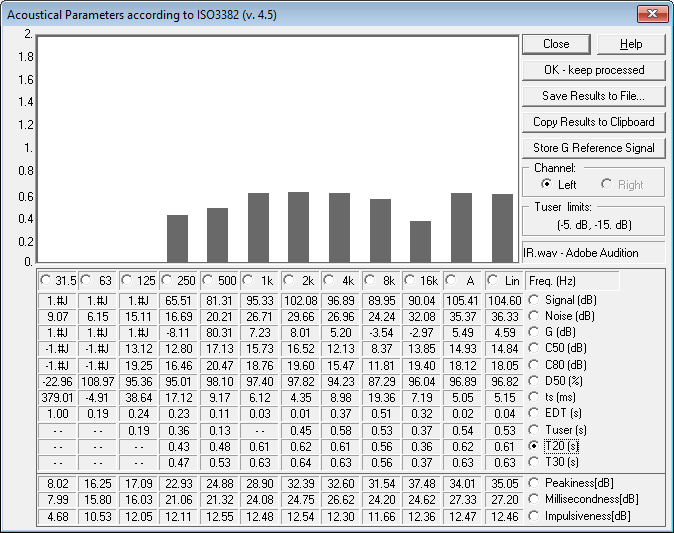
We can show the energetic impulse response at each frequency; we can also chart a specific acoustical parameter, for example reverberation time T20:
t5ta3d

The computed acoustical parameters can obviously be copied to the clipboard, and pasted in Excel, or saved directly to a TXT file.

Now, if anyone has questions or needs clarification, please post your questions here below...

Edited by angelo.farina - 4/11/2019, 09:04
 
Web  Top
john30
view post Posted on 18/3/2015, 03:49


I measured room impulse response by following this guide,
and I got the impulse response,
To compare the difference between the estimated room impulse response which is obtained by using matlab image method and measured room impulse reponse (Aurora-plug),
But I can see the difference between these two impulse response,

First, the estimated room impulse response (image method) has the small value
[-0.015 ~ 0.02]


and measured room impulse response (Aurora-plug) has the big value
[-0.5 ~ 0.8],


I wonder if the measured room impulse response [Aurora-plug] has a normalized value?
and If Ii is a normalized value, How can I get the non-normalized value?
I think it result of the [gain applied for rescaling]


Second, I convolved between the remasured room impulse response [Aurora-plug] and generated sine sweep signal , but the result of the convolved signal has a bigger value than recorded sine sweep signal,
I think that convolved signal and recorded sine sweep signal have a same value,


Thank you for reading this script,

Have a nice day!
 
Top
john31
view post Posted on 18/3/2015, 04:04


CITAZIONE (john30 @ 18/3/2015, 03:49) 
I measured room impulse response by following this guide,
and I got the impulse response,
To compare the difference between the estimated room impulse response which is obtained by using matlab image method and measured room impulse reponse (Aurora-plug),
But I can see the difference between these two impulse response,

First, the estimated room impulse response (image method) has the small value
[-0.015 ~ 0.02]


and measured room impulse response (Aurora-plug) has the big value
[-0.5 ~ 0.8],


I wonder if the measured room impulse response [Aurora-plug] has a normalized value?
and If Ii is a normalized value, How can I get the non-normalized value?
I think it result of the [gain applied for rescaling]


Second, I convolved between the remasured room impulse response [Aurora-plug] and generated sine sweep signal , but the result of the convolved signal has a bigger value than recorded sine sweep signal,
I think that convolved signal and recorded sine sweep signal have a same value,


[first up figure : convolved signal, down figure : recorded sweep signal]


Thank you for reading this script,

Have a nice day!
 
Top
view post Posted on 1/4/2015, 14:11
Avatar

http://www.angelofarina.it

Group:
Administrator
Posts:
365
Location:
Parma, Italy

Status:


Well, amplitude scaling is always a problem when performing impulse response measurements or when computing a numerical impulse response on a computer.
Let's start from the beginning of digital system theory: an impulse response is defined as the response of your system when stimulated by the Dirac's Delta impulse signal, which in turn is defined as a signal having just one digital sample different from zero and with"unit" amplitude:
0,0,0,0,0,1,0,0,0,0,.....
The problem starts here, what does this "unit" amplitude means?
This turns back to the definition of your system: what is the "device under test", and what is the ancillary equipment necessarily employed for the measurement, but not being part of the system?
As an example, I give you two possible answers:
1) for people working in the field of audio and loudspeakers, the system "begins" with an electrical signal, possibly before or after the power amplifier, and feeding the loudspeaker. And the system "ends" again with the electrical signal coming from the microphone, either before or after the preamplifier. Assuming for simplicity that both the power amplifier and the mic preamp have unit gain, this means that the transfer function of your system is measured as Volts/Volts, and hence is dimensionless. In this case everything is easy: an "ideal" system will have an impulse response which is, again, a Dirac's Delta function, and hence applying an 1V signal to the loudspeaker, the microphone should output a 1V signal.
2) for people working in room acoustics, loudspeakers and microphones are NOT part of the system: an unit source is a point source emitting a reference positive pressure peak, lasting just one sample, and causing some "calibrated" peak pressure at a fixed distance, for example common references are 1Pa at 1m (what I use usually, as it corresponds to a value of Lw=94-3+11=102 dB RMS, which is approximately the power level of my dodecaedron loudspeaker, after equalization and calibration) or 1Pa at 10m (the ISO3382 reference for calculating of the Strenght parameter G). At the receiver, the output of the system is again a pressure. So the "ideal" system is of course anecoic, and is obtained placing the microphone at the above-defined reference distance, so that an unit-pressure signal is recorded.

After having clarified that, we need to calibrate the measurement system employed for room acoustics measurements. This calibration must be performed in an anechoic room, or in a normal room provided that is large enough so that you can "cut away" room reflections, leaving you with an anechoic impulse response which is long enough (at least 20 ms after the direct sound).
Place the microphone at a reasonable distance from the sound source (not necessarily equal to the "reference" distance: in my case I use a ref.distance of 1m, but I place the microphone typically at 4m from the source), as you can easily rescale the results by multiplying the measured pressure by the ratio d/r (where d is the effective distance and r is the reference distance).
At this point you carefully optimize the gains of the power amplifier and of the mic preamp, so that the loudspeaker does not distort too much, and the microphone does not clip (leaving typically a safety headroom of 12 dB). After this, you should lock the gains and do not change them anymore...
And you should also define the "rescaling gain" employed during convolution with the inverse sweep, so that the measured anechoic IR, rescaled for the reference distance, results in a pressure peak of unit amplitude.
At this point your measurement system is calibrated. You can use it for your measurement in rooms, without changing any gain...

Now, for comparing with your numerical simulations, you should enforce a similar calibration also to them: simulate the free field with just your point source and one receiver at the reference distance and no room: the simulation should provide just one peak ( the direct sound) and you need to adjust the gain so that this peak is unit amplitude.

I hope that the explanation is clear...
Most people, indeed, do not perform such calibration, do not care of overall gain, and rescale the measured IR so that the amplitude of the direct sound peak "fits" with the simulated value: the concept is that nothing can go wrong in the measurement and the simulation of the direct sound, so they should necessarily match. My experience, indeed, employing dodechaedron sources, is that many things can go wrong, and thus I always recommend a careful calibration of the measuring system in anechoic conditions, and possibly also a careful digital equalization of the system, so that its anechoic measurement becomes really an almost perfect Dirac's Delta function. The Inverse Kirkeby plugin is great for performing such digital equalization...
 
Web  Top
view post Posted on 9/6/2015, 22:55

Junior Member

Group:
Member
Posts:
5

Status:


Hi Angelo.

Your page it's very interesting and usefull for us.

I have a doubt.......

When we use a mic for measurement the sweep of a source (omnidirectional source) who is far from it......for example 15 meters......the sound must travel 43ms to the mic right?.....

My question is.....these time......how influence in the measurement.....or how's aura fix these issue?.

Thanks for you time Angelo!
 
Top
view post Posted on 26/6/2015, 23:38
Avatar

http://www.angelofarina.it

Group:
Administrator
Posts:
365
Location:
Parma, Italy

Status:


That's called "time of flight", is the gap of silence before the direct sound.
The definition of most parameters given in the ISO 3382 standard does not take into any account the time of flight, as the "zero of time" is taken at the rising time of the peak of the direct sound.
Aurora locates this point by means of a trigger (Direct Sound Trigger), which by default is set to detect the first sample where the signal becomes larger than a value which is 20 dB smaller than the maximum. Of course you can change the trigger sensitivity by changing this value, in the initial screen of the acoustics parameters plugin.
Once the trigger point has been found, everything happening before it is just ignored in the computation of Clarity, Center Time, Definition, IACC, LF, etc...
 
Web  Top
view post Posted on 26/2/2017, 11:23
Avatar

Junior Member

Group:
Member
Posts:
27

Status:


dear Angelo (thanks for these great tools!)
I have a couple of questions:

1. Is there anything wrong if I use a sweep limited to 20-1000 Hz? I just wonder if the Aurora tools assume that one always uses sweeps between 20 and 20k Hz.
I'm characterizing tactile transducers and I'm only interested in frequencies below 1 kHz. I record the transducers' response with a measurement accelerometer (frequency response flat +/- 5% between 5-15000 Hz).

2. I usually measure simple vibration signals such as sine waves or band-passed noise, recording them as audio. The sensitivity specifications of the whole I/O chain are known, and making use of them I can easily obtain the corresponding values of acceleration in m/s^2. Of course for this to work, the first step is to make sure that the digital amplitudes in dBFS are meaningful. So my question is: does Aurora (namely, the convolution of sweep response with inverted sweep) alter in some way amplitudes?

Edited by stepap - 2/26/2017, 02:49 PM
 
Top
view post Posted on 20/4/2017, 15:30
Avatar

http://www.angelofarina.it

Group:
Administrator
Posts:
365
Location:
Parma, Italy

Status:


QUOTE (stepap @ 2/26/2017, 12:23 PM) 
dear Angelo (thanks for these great tools!)
I have a couple of questions:

1. Is there anything wrong if I use a sweep limited to 20-1000 Hz? I just wonder if the Aurora tools assume that one always uses sweeps between 20 and 20k Hz.
I'm characterizing tactile transducers and I'm only interested in frequencies below 1 kHz. I record the transducers' response with a measurement accelerometer (frequency response flat +/- 5% between 5-15000 Hz).

2. I usually measure simple vibration signals such as sine waves or band-passed noise, recording them as audio. The sensitivity specifications of the whole I/O chain are known, and making use of them I can easily obtain the corresponding values of acceleration in m/s^2. Of course for this to work, the first step is to make sure that the digital amplitudes in dBFS are meaningful. So my question is: does Aurora (namely, the convolution of sweep response with inverted sweep) alter in some way amplitudes?

1) You choose the minimum and maximum frequency according to your needs, but be aware of the rule of thumb: always start one octave below and end one octave above your useful frequency range. So, if you are interested in frequencies between 20 Hz and 1000 Hz, I would suggest to use a sweep from 10 Hz to 2 kHz.

2) of course the convolution with the inverse sweep changes the gain, reducing the noise by something as 60-80 dB, and consequently also the signal is scaled down of the same amount. It is still possible to calibrate the amplitude of the resulting impulse response, performing the convolution with the inverse sweep with a fixed gain, and then setting properly the value of Full Scale in the Acoustical Parameter module.
 
Web  Top
view post Posted on 20/4/2017, 16:14
Avatar

Junior Member

Group:
Member
Posts:
27

Status:


Thank you Angelo, that's very helpful!
 
Top
bobnoise
view post Posted on 20/11/2017, 11:16


Hello Angelo

I just wanted to check with you, the guide is written for wired full duplex analysis, but would there be any problems using a calibrated wave recording class 1 SLM, calibrated speaker and recorded sweep signal and recorded filtered pink noise signal? So that all of the test room equipment is fully portable and not PC attached

thank-you
 
Top
view post Posted on 20/11/2017, 15:36
Avatar

http://www.angelofarina.it

Group:
Administrator
Posts:
365
Location:
Parma, Italy

Status:


No problem.
For STI measurements, I usually employ a Bruel & Kjaer 2250 SLM, which records the full WAV file of the microphone signals.
It is not connected in any way with the computer generating the test signals being sent to the artificial mouth.
Typically, I create a sound file containing:

- 30s of equalized pink noise
- 30s of silence
- 30s of exponential sine sweep (25s of sweep, 5s of silence).

Then I play-loop the file continuosly.

While it is playing, I go around the room, and in each position I record on the SLM the complete 90s-long sequence.
Later one, processing the three 30s-segments I get the three required sound samples for computing STI (Signal+Noise, Noise and Impulse Response).
 
Web  Top
Amit Singh
view post Posted on 12/4/2018, 07:26


Thanks for this article.
How to invoke the aurora plugins in adobe audition?
 
Top
view post Posted on 12/4/2018, 07:34

Junior Member

Group:
Member
Posts:
94

Status:


If you copy the XFM files in the same directory where Adobe Audition (1.5 or 3.0) is installed, the plugins will appear in the menus of Audition.
Alternatively, you can use Aurora for Audacity: www.angelofarina.it/Public/Aurora-for-Audacity/
 
Top
view post Posted on 18/5/2018, 13:35

Junior Member

Group:
Member
Posts:
2

Status:


Hi Angelo!
I am trying the Audacity modules, can you post a tutorial for that too? I cannot understand how to convolve with the inverse sweep
 
Top
view post Posted on 21/12/2018, 11:49

Junior Member

Group:
Member
Posts:
94

Status:


It is trivial.
First of all, select all your waveforms (CTRL+A).
Then invoke the Effect - Aurora Convolver module, drag your recorded signal to "data" and the inverse sweep to "filter"....
Aurora
 
Top
19 replies since 21/1/2011, 00:20   16962 views
  Share